Display Component
The display component houses ESPHome’s graphical rendering and display
engine. It caters for a wide range of different display types, from simple character displays to
graphical displays with fully addressable pixels.
-
Character displays like 7-Segment displays or LCD displays.
-
Serial displays like Nextion that have their own processors for graphics rendering.
-
Graphical displays with fully addressable pixels, such as SPI interfaced LCDs, E-Paper, HUB75 LED matrices, and OLED.
For graphical displays, which offer the greatest flexibility, there are two options for displaying content:
- ESPHome’s own rendering engine
- LVGL - Light and Versatile Graphics Library
Configuration variables
Section titled “Configuration variables”All display components inherit these configuration variables.
- id (Optional, ID): Manually specify the ID used for code generation. Required if there are multiple displays.
- update_interval (Optional, Time): The interval to re-draw the screen. Defaults to
1s. - lambda (Optional, lambda): The lambda to use for rendering the content on the display. See Display Rendering Engine for more information.
All graphical displays also inherit these configuration variables.
- auto_clear_enabled (Optional, boolean): If the display should be cleared before each update. Defaults to
trueif a lambda or pages are configured, false otherwise. - show_test_card (Optional, boolean): If the display should show a test card. Defaults to
false. If set, any code in thelambdaconfig option will be ignored. - rotation (Optional, integer): The rotation of the display in degrees, one of 0, 90, 180 or 270. Defaults to
0. - pages (Optional, list): Pages configuration - see below.
Display Rendering Engine
Section titled “Display Rendering Engine”ESPHome’s own powerful rendering engine can handle many common tasks such as drawing basic shapes, printing text with fonts of your choice, or even rendering images.
To achieve all this flexibility displays tie in directly into ESPHome’s lambda system. So when you want to write some text or sensor values to the screen you will be writing in C++ code using an API that is designed to
- be simple and to be used without programming experience
- but also be flexible enough to work with more complex tasks like displaying an analog clock.
In this section we will be discussing how to use ESPHome’s display rendering engine from ESPHome and some basic commands. Please note that this only applies to displays that can control each pixel individually.
NOTE
Display hardware is complex and sometimes doesn’t behave as expected. If you’re having trouble with your display, please see Troubleshooting below.
So, first a few basics: When setting up a display platform in ESPHome there will be a configuration
option called lambda: which will be called every time ESPHome wants to re-render the display.
In each cycle, the display is automatically cleared before the lambda is executed. You can disable
this behavior by setting auto_clear_enabled: false.
In the lambda, you can write code like in any lambda in ESPHome. Display
lambdas are additionally passed a variable called it which represents the rendering engine object.

display:  - platform: ...    # ...    lambda: |-      // Write your display rendering code here
      // For example, draw a line from [x=0,y=0] to [x=50,y=50]      it.line(0, 0, 50, 50);
NOTE
Lambdas are essentially just a lightly modified version of C++. So don’t forget to end each line
with a semicolon (; ). Otherwise you will be greeted by a long error message at the compilation stage.
If you compile and upload the configuration above, you should see a black (or white, depending on the display)
line which starts at the top left and goes a few pixels down at a 45° angle. (If it’s in another corner, use the
rotation: option to rotate the display to your liking)
This already highlights one of the things you must learn before diving into writing your own custom display code:
The top left is always the origin of the pixel coordinate system. Also, all points in this coordinate system
are a pair of integers like 50, 50 which represent the shift to the right and shift downwards. So, in other words,
x always represents the horizontal axis (width) and y the vertical axis (height). And the convention in
the rendering engine is always first specify the x coordinate and then the y coordinate.
Basic Shapes
Section titled “Basic Shapes”Now that you know a bit more about ESPHome’s coordinate system, let’s draw some basic shapes like lines, rectangles, circles or even polygons:
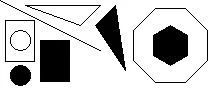
display:  - platform: ...    # ...    lambda: |-      // Draw a line from [0,0] to [100,50]      it.line(0, 0, 100, 50);      // Draw the outline of a rectangle with the top left at [5,20], a width of 30 and a height of 42      it.rectangle(5, 20, 30, 42);      // Draw the same rectangle a few pixels apart, but this time filled      it.filled_rectangle(40, 40, 30, 42);
      // Circles! Let's draw one with the center at [20,40] and a radius of 10      it.circle(20, 40, 10);      // ... and the same thing filled again      it.filled_circle(20, 75, 10);
      // Ring and half-ring. First draw the circle with a hole in it      // at [75,75] with inner raduis of 20 and outer of 30      it.filled_ring(75, 75, 30, 20);      // and a "gauge": half-ring that is partially filled.      // Same position and size but 80% filled left to right      it.filled_gauge(75, 75, 30, 20, 80);
      // Triangles... Let's draw the outline of a triangle from the [x,y] coordinates of its three points      // [25,5], [100,5], [80,25]      it.triangle(25, 5, 100, 5, 80, 25);      // and a filled triangle !      it.filled_triangle(115, 5, 95, 25, 125, 70);
      // Regular Polygons? Let's draw a filled, pointy-topped hexagon inscribed in a circle      // centered on [170,45] with a radius of 20      it.filled_regular_polygon(170, 45, 20, EDGES_HEXAGON);      // and the outline of flat-topped octagon around it!      it.regular_polygon(170, 45, 40, EDGES_OCTAGON, VARIATION_FLAT_TOP);      // Need to rotate the polygon, or retrieve the coordinates of its vertices? Check the API!
All the above methods can optionally also be called with an argument at the end which specifies in which
color to draw. For monochrome displays, only COLOR_ON (the default if color is not given) and COLOR_OFF are supported.
display:  - platform: ...    # ...    lambda: |-      // Turn the whole display on      it.fill(COLOR_ON);      // Turn the whole display off      it.fill(COLOR_OFF);
      // Turn a single pixel off at [50,60]      it.draw_pixel_at(50, 60, COLOR_OFF);
For color displays (e.g. TFT displays), you can use the Color class.

display: - platform: ... # ... lambda: |- auto black = Color(0, 0, 0); auto red = Color(255, 0, 0); auto green = Color(0, 255, 0); auto blue = Color(0, 0, 255); auto white = Color(255, 255, 255); it.filled_circle(20, 32, 15, black); it.filled_circle(40, 32, 15, red); it.filled_circle(60, 32, 15, green); it.filled_circle(80, 32, 15, blue); it.filled_circle(100, 32, 15, white);Additionally, you have access to two helper methods which will fetch the width and height of the display:
display:  - platform: ...    # ...    lambda: |-      // Draw a circle in the middle of the display      it.filled_circle(it.get_width() / 2, it.get_height() / 2, 20);
      // Turn off bottom half of the screen      it.filled_rectangle(0, it.get_height()/2, it.get_width(), it.get_height()/2, COLOR_OFF);
You can view the full API documentation for the rendering engine in the “API Reference” in the See Also section.
Drawing Static Text
Section titled “Drawing Static Text”To be able to display text, you need to prepare some fonts. ESPHome’s font renderer allows you to use OpenType/TrueType/Bitmap fonts for your texts. This is very flexiblle because you can prepare various sets of fonts at different sizes with a different number of glyphs which is extremely convenient when we’re talking about flash space.
In your display code, you can render static text by referencing the font and just entering your string enclosed in double quotes:
display: - platform: ... # ... lambda: |- // Print the string "Hello World!" at [0,10] it.print(0, 10, id(my_font), "Hello World!");By default, ESPHome will align the text at the top left. That means if you enter the coordinates
[0,10] for your text, the top left of the text will be at [0,10]. If you want to draw some
text at the right side of the display, it is however sometimes useful to choose a different text alignment.
When you enter [0,10] you’re really telling ESPHome that it should position the anchor point of the text
at [0,10]. When using a different alignment, like TOP_RIGHT, the text will be positioned left of the anchor
pointed, so that, as the name implies, the anchor point is a the top right corner of the text.
display:  - platform: ...    # ...    lambda: |-      // Aligned on left by default      it.print(0, 0, id(my_font), "Left aligned");
      // Aligned on right edge      it.print(it.get_width(), 0, id(my_font), TextAlign::TOP_RIGHT, "Right aligned");
As with basic shapes, you can also specify a color for the text:
display: - platform: ... # ... lambda: |- // Syntax is always: it.print(<x>, <y>, <font>, [color=COLOR_ON], [align=TextAlign::TOP_LEFT], <text>); it.print(0, 0, id(my_font), COLOR_ON, "Left aligned");In case of fonts rendered at higher bit depths, the background color has to be specified after the text in order for antialiasing to work:
display: - platform: ... # ... lambda: |- // Syntax is always: it.print(<x>, <y>, <font>, [color=COLOR_ON], [align], <text>, [color=COLOR_OFF]); it.print(0, 0, id(my_font_with_icons), COLOR_ON, TextAlign::CENTER, "Just\U000f05d4here. Already\U000F02D1this.", COLOR_OFF);Formatted Text
Section titled “Formatted Text”Static text by itself is not too impressive. What we really want is to display dynamic content like sensor values
on the display!. That’s where printf comes in. printf is a formatting engine from the C era and ESPHome
chose to use because … well, I’m too lazy to create a fully-fledged format engine where the existing stuff
is way better documented :)
printf can do way more stuff than you will probably ever need, but it’s also quite simple for the basic stuff.
For example, a printf call can look like this:
sensor:  - platform: ...    # ...    id: my_sensor
display:  - platform: ...    # ...    lambda: |-      it.printf(0, 0, id(my_font), "The sensor value is: %.1f", id(my_sensor).state);      // If the sensor has the value 30.02, the result will be: "The sensor value is: 30.0"
As you can see, when you call printf most of the string is printed as-is, but when this weird percent sign with some
stuff after it is encountered, it is magically replaced by the argument after the format (here id(my_sensor).state ).
Every time you type a percent sign % in a printf format string, it will treat the following letters as a format tag
until a so-called “specifier” is encountered (in this case f ). You can read more about it
at https://www.tutorialspoint.com/c_standard_library/c_function_printf.htm,
but for ESPHome there are really just a few things you need to know.
Let’s break %.1f down:
%- initiate the format string.1- round the decimal number to1digits after the decimal point.f- the specifier which tells printf the data type of the argument. Here it is a f(loat).
For example, if you would like to print a sensor value with two digits of accuracy, you would write %.2f and with
zero digits of accuracy (without a decimal) %.0f.
Another interesting format string is %7.2f, which would become the right-justified string
" 20.51" for a value of 20.506.
-
%- initiate the format -
7- means that the number will be right-justified and be padded on the left by spaces if the result would be shorter than 7 characters long. -
.2- round the decimal number to2digits after the decimal point. -
f- specifier: f(loat).
You can even have as many formatted items as you want in a single printf call. Just make sure the put the arguments after the format string in the right order.
display: - platform: ... # ... lambda: |- // %% - literal % sign it.printf(0, 0, id(my_font), "Temperature: %.1f°C, Humidity: %.1f%%", id(temperature).state, id(humidity).state);To display a text string from a text_sensor, append .c_str() to the end of your variable.
display: - platform: ... # ... lambda: |- it.printf(0, 0, id(my_font), "Text to follow: %s", id(template_text).state.c_str());When using anti-aliased fonts you will probably need to specify the color to draw the characters, and the background
color to mix in for anti-aliasing. This requires the full version of printf, e.g.:
display: - platform: ... # ... lambda: |- it.printf(10, 100, id(roboto), Color(0x123456), COLOR_OFF, display::TextAlign::BASELINE, "%f", id(heap_free).state);The last printf tip for use in displays I will discuss here is how to display binary sensor values. You
could of course just check the state with an if statement as the first few lines in the example below, but if
you want to be efficient you can use an inline if too. With the %s print specifier you can tell it to
use any string you pass it, like "ON" or "OFF".
binary_sensor:  - platform: ...    # ...    id: my_binary_sensor
display:  - platform: ...    # ...    lambda: |-      if (id(my_binary_sensor).state) {        it.print(0, 0, id(my_font), "state: ON");      } else {        it.print(0, 0, id(my_font), "state: OFF");      }      // Shorthand:      it.printf(0, 0, id(my_font), "State: %s", id(my_binary_sensor).state ? "ON" : "OFF");
NOTE
For displaying external data on the display, for example data from your Home Assistant instance, you can use the Mqtt Subscribe (see the example there for more information).
Displaying Time
Section titled “Displaying Time”You can display current time using a time component. Please see the example on the time documentation.
Screen Clipping
Section titled “Screen Clipping”Screen clipping can be useful when you just want to show a part of an image or make sure that what you draw on the screen does not go outside a specific region on the screen.
With start_clipping(left, top, right, bottom); start you the clipping process and when you are done drawing in that region
you can stop the clipping process with end_clipping();. You can nest as many start_clipping(); as you want as long
you end them as many times as well.
binary_sensor:  - platform: ...    # ...    id: my_binary_sensor
color:  - id: my_red    red: 100%
display:  - platform: ...    # ...    lambda: |-      if (id(my_binary_sensor).state) {        it.print(0, 0, id(my_font), "state: ON");      } else {        it.print(0, 0, id(my_font), "state: OFF");      }      // Shorthand:      it.start_clipping(40,0,140,20);      it.printf(0, 0, id(my_font), id(my_red), "State: %s", id(my_binary_sensor).state ? "ON" : "OFF");      it.end_clipping();
After you started clipping you can manipulate the region with extend_clipping(left, top, right, bottom);
and shrink_clipping(left, top, right, bottom); within previous set clipping region.
With get_clipping(); you get a Rect object back with the latest set clipping region.
class Rect { int16_t x; ///< X/Left coordinate int16_t y; ///< Y/Top coordinate int16_t w; ///< Width int16_t h; ///< Height int16_t x2(); ///< Right coordinate int16_t y2(); ///< bottom coordinate };With is_clipping(); tells you if clipping is activated.
When using RGB-capable displays in ESPHome you may wish to use custom colors.
A color component exists for just this purpose:
color: - id: my_light_red red: 100% green: 20% blue: 25% white: 0%Alternatively, you can use <color>_int to specify the color as an int value:
color: - id: my_light_red red_int: 255 green_int: 51 blue_int: 64 white_int: 0Or, if you are more comforatble with hex values, you can use hex :
color: - id: my_light_red hex: FF3340Configuration variables:
- red (Optional, percentage): The percentage of the red component. Defaults to
100%. - red_int (Optional, integer): The brightness of the red component on a scale of
0to255. Defaults to255. - green (Optional, percentage): The percentage of the green component. Defaults to
100%. - green_int (Optional, integer): The brightness of the green component on a scale of
0to255. Defaults to255. - blue (Optional, percentage): The percentage of the blue component. Defaults to
100%. - blue_int (Optional, integer): The brightness of the blue component on a scale of
0to255. Defaults to255. - white (Optional, percentage): The percentage of the white component. Defaults to
100%. - white_int (Optional, integer): The brightness of the white component on a scale of
0to255. Defaults to255. - hex (Optional, string): The color in hexadecimal representation. Defaults to
FFFFFF.
RGB displays use red, green, and blue, while grayscale displays may use white.
Display Pages
Section titled “Display Pages”Certain display types also allow you to show “pages”. With pages you can create drawing lambdas that you can switch between. For example with pages you can set up 3 screens, each with different content, and switch between them on a timer.
display: - platform: ... # ... id: my_display pages: - id: page1 lambda: |- it.print(0, 10, id(my_font), "This is page 1!"); - id: page2 lambda: |- it.print(0, 10, id(my_font), "This is page 2!");You can then switch between these with three different actions:
display.page.show_next / display.page.show_previous Action
Section titled “display.page.show_next / display.page.show_previous Action”Shows the next or previous page, wraps around at the end.
on_...:  - display.page.show_next: my_display  - display.page.show_previous: my_display
# For example cycle through pages on a timerinterval:  - interval: 5s    then:      - display.page.show_next: my_display      - component.update: my_display
display.page.show Action
Section titled “display.page.show Action”Show a specific page.
on_...:  - display.page.show: page1
  # Templated  - display.page.show: !lambda |-      if (id(my_binary_sensor).state) {        return id(page1);      } else {        return id(page2);      }
NOTE
To trigger a redraw right after the page show use a component.update action:
# For example cycle through pages on a timerinterval: - interval: 5s then: - display.page.show_next: my_display - component.update: my_displaydisplay.is_displaying_page Condition
Section titled “display.is_displaying_page Condition”This condition returns true while the specified page is being shown.
# In some trigger:on_...: - if: condition: display.is_displaying_page: page1 then: ... - if: condition: display.is_displaying_page: id: my_display page_id: page2 then: ...on_page_change: This automation will be triggered when the page that is shown changes.
display: - platform: ... # ... on_page_change: - from: page1 to: page2 then: lambda: |- ESP_LOGD("display", "Page changed from 1 to 2");- from (Optional, ID): A page id. If set the automation is only triggered if changing from this page. Defaults to all pages.
- to (Optional, ID): A page id. If set the automation is only triggered if changing to this page. Defaults to all pages.
Additionally, the old page will be given as the variable from and the new one as the variable to.
Troubleshooting
Section titled “Troubleshooting”Using the Color Test Card
Section titled “Using the Color Test Card”If you’re experiencing issues with your color display, the show_test_card: true option can help you to identify what might be wrong.
- It will show bars for Red, Green and Blue, graduating to black and white.
- Together with that it will show the letters “R”, “G” and “B” to validate the display geometry.
- There will be a rectangle around the corners of the display with a marker at the 0,0 corner which should be at the top left of the screen.
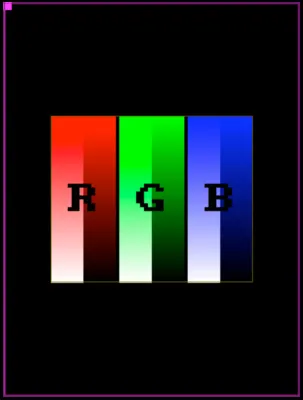
When all points above are shown correctly then the display is working as expected. To help the graphics display team determine the best way to help you, a picture of the result of this option is very helpful.
Should you create an issue in GitHub regarding your display, please be sure to include a link to where you purchased the display so that we can validate the configuration you’ve used.
NOTE
If you set update_interval: never in your config you will not see the test card because the display: component will not update the display with the test card. If you want to see a test card, set update_interval: to something other than never.
NOTE
For displays in 8 bit mode you will see distinct color blocks rather than a smooth gradient.